Graphic Designer Salary in Washington: $75,551 (2026)
Quick Answer:Across Washington's 50 metropolitan areas, the average median graphic designer pay sits at $75,551/year heading into 2026 — a figure projected from 2025 BLS OEWS wage data for SOC 27-1024. Because Washington sits at BEA RPP 107.4 (7% above the U.S. baseline), that statewide median translates to roughly $70,345 in nationally-comparable purchasing power. Highest-paying metros: Bellevue ($77,472), Seattle ($76,720), Vancouver ($76,137).
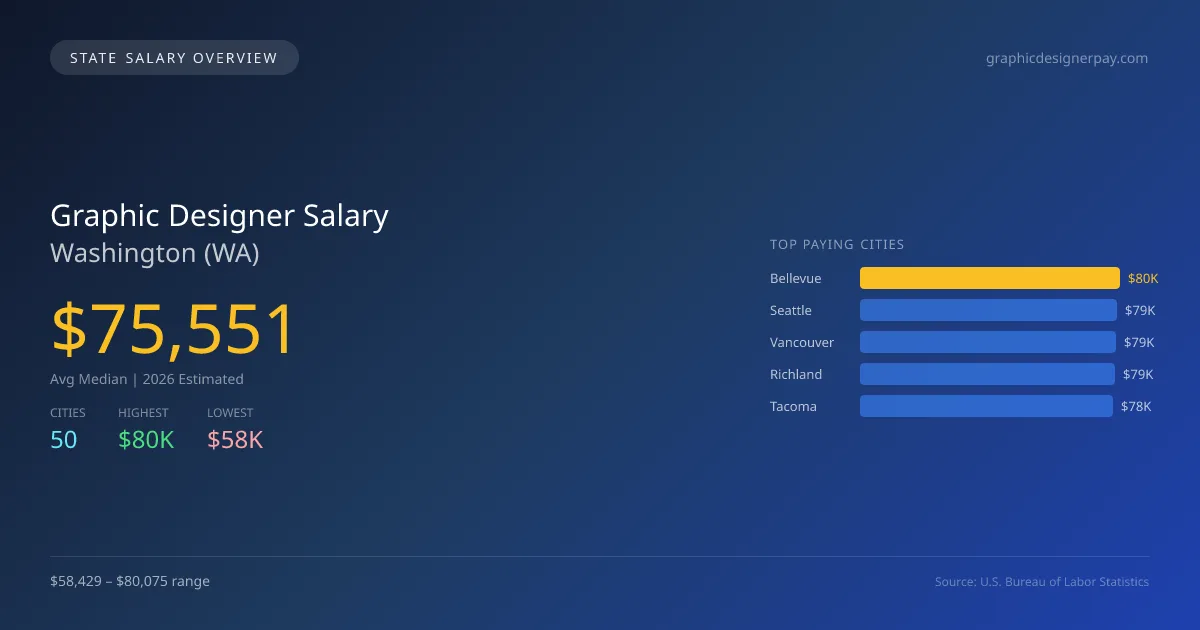
In Washington, the average median salary for graphic designers in 2026 is projected at $75,551, which is significantly higher than the national median of $65,075, reflecting a difference of +16.1%. The highest-paying city in the state is Bellevue, where salaries reach $80,075, while Spokane offers the lowest at $58,429, creating a salary gap of $21,646. This disparity is influenced by factors such as cost of living, demand for design services, and the concentration of tech and creative industries in cities like Bellevue and Seattle. The projected annual growth rate for graphic design jobs in Washington is 3.36%, indicating a positive job market outlook. State-specific factors, including licensing requirements and scope of practice laws, are less stringent for graphic designers compared to other professions, allowing for greater flexibility in job opportunities. Major cities contributing to this growth include Seattle at $79,298, Vancouver at $78,695, Richland at $78,629, and Tacoma at $77,975. With nearly 3,970 graphic designers employed statewide, demand is expected to be driven by ongoing advancements in technology and a thriving digital economy, further solidifying Washington as a key state for design professionals.
Washington Graphic Designer Salary Range
Overall salary range in Washington: $36,324 (lowest entry-level) to $130,492 (highest top earner)
Washington vs National Average
Washington graphic designers earn 16.10% more than the national median (+$10,476/year difference).
Washington Graphic Designer Salary Distribution (2026)
Graphic Designer salaries in Washington range from $50,906 (entry-level, 10th percentile) to $121,927 (top earners, 90th percentile), with a median of $75,551. The Washington median is $10,476 above the US national median of $65,075. The average hourly rate is $36.33/hr. Approximately 3,970 graphic designers are employed across 50 cities.
2019 BLS Actual
$64,233
2025 BLS Actual
$73,095
2026 Current Est.
$75,551
2019–2027 Growth
+21.6%
Salary Trajectory for Graphic Designers in Washington (2019–2027)
2019–2025: actual BLS OEWS data for this metro area. 2026+: CAGR 3.36% projection.
| Year | Annual Salary | Status |
|---|---|---|
| 2019 | $64,233 | Actual |
| 2020 | $68,789 | Actual |
| 2021 | $62,317 | Actual |
| 2022 | $71,128 | Actual |
| 2023 | $70,901 | Actual |
| 2024 | $78,530 | Actual |
| 2025 | $73,095 | Actual |
| 2026(current) | $75,551 | Estimated |
| 2027 | $78,089 | Projected |
Based on 7 years of BLS OEWS data for the Washington metropolitan area, the median graphic designer salary grew 13.8% from $64,233 (2019) to $73,095 (2025). At a 3.36% compound annual growth rate, salaries are projected to reach $78,089 by 2027 — a total increase of $13,856 (21.57%) from 2019.
Note: Historical values (2019–2025) are actual BLS OEWS figures for the Washington metropolitan area, sourced from annual Occupational Employment and Wage Statistics surveys. 2026–2026 figures are current estimates, and 2027 values are projections, calculated using a 3.36% CAGR derived from 7-year BLS historical data. Actual salaries may vary based on employer, experience, certifications, and local market conditions.
Top 5 Highest Paying Cities in Washington
Lowest Paying Cities in Washington
| City | Median Salary |
|---|---|
| Spokane | $58,429 |
| Spokane Valley | $59,554 |
| Yakima | $59,918 |
| Bellingham | $61,861 |
| Tukwila | $64,689 |
Best Value Cities for Graphic Designers in Washington
When adjusted for local cost of living, these Washington cities offer the most purchasing power for graphic designers.
| City | Nominal Salary | CoL Index | Adjusted Salary |
|---|---|---|---|
| Kennewick | $77,024 | 100.079 | $76,963 |
| Bellevue | $80,075 | 107.4 | $74,558 |
| Vancouver | $78,695 | 107.4 | $73,273 |
| Richland | $78,629 | 107.4 | $73,211 |
| Tacoma | $77,975 | 107.4 | $72,602 |
Adjusted salary = nominal salary × (100 / CoL index). CoL index: 100 = national average. Lower index = lower cost of living.
Salary by Experience Level in Washington
| Experience Level | Estimated Annual |
|---|---|
| Entry Level (0-2 years) | $50,906 |
| Mid Career (3-7 years) | $75,551 |
| Experienced (7+ years) | $121,927 |
Estimates based on BLS percentile data averaged across Washington metro areas. Individual pay varies by employer, certifications, and specialization.
All 50 Cities in Washington
| # | City | Median Salary |
|---|---|---|
| 1 | Bellevue | $80,075 |
| 2 | Seattle | $79,298 |
| 3 | Vancouver | $78,695 |
| 4 | Richland | $78,629 |
| 5 | Tacoma | $77,975 |
| 6 | Kennewick | $77,024 |
| 7 | Bremerton | $72,786 |
| 8 | Renton | $71,813 |
| 9 | Everett | $71,118 |
| 10 | Tumwater | $70,626 |
| 11 | Marysville | $70,585 |
| 12 | Shoreline | $70,197 |
| 13 | Olympia | $69,985 |
| 14 | Redmond | $69,920 |
| 15 | Kent | $69,862 |
| 16 | Kirkland | $69,748 |
| 17 | Burien | $69,659 |
| 18 | Lacey | $69,411 |
| 19 | Federal Way | $69,354 |
| 20 | Des Moines | $69,338 |
| 21 | Auburn | $69,177 |
| 22 | Lakewood | $69,150 |
| 23 | Issaquah | $69,111 |
| 24 | Sammamish | $68,656 |
| 25 | University Place | $68,632 |
| 26 | SeaTac | $68,578 |
| 27 | Pasco | $68,285 |
| 28 | Longview | $68,252 |
| 29 | Mount Vernon | $68,078 |
| 30 | Edmonds | $67,866 |
| 31 | Lake Stevens | $67,687 |
| 32 | Lynnwood | $67,644 |
| 33 | Moses Lake | $67,514 |
| 34 | Bothell | $67,464 |
| 35 | Pullman | $67,166 |
| 36 | Puyallup | $67,013 |
| 37 | Ellensburg | $66,762 |
| 38 | Maple Valley | $66,579 |
| 39 | Walla Walla | $66,433 |
| 40 | Camas | $66,411 |
| 41 | Wenatchee | $66,357 |
| 42 | Oak Harbor | $66,131 |
| 43 | Kenmore | $65,704 |
| 44 | Covington | $65,699 |
| 45 | Mountlake Terrace | $64,789 |
| 46 | Tukwila | $64,689 |
| 47 | Bellingham | $61,861 |
| 48 | Yakima | $59,918 |
| 49 | Spokane Valley | $59,554 |
| 50 | Spokane | $58,429 |
More Washington Salary Data
Senior / Experienced
Top earner salaries for experienced graphic designers.
Compare Cities in Washington
View all comparisons →Explore More Graphic Designer Salary Data
Frequently Asked Questions
How much do graphic designers make in Washington in 2026?
What is the highest paying city for graphic designers in Washington?
How does Washington graphic designer pay compare to the national average?
What is the entry-level graphic designer salary in Washington?
How many graphic designers are employed in Washington?
Which Washington city offers the best value for graphic designers?
Written by Jordan Lee, MFA
Career Analyst
Jordan Lee has 10 years of experience in graphic design. They specialize in branding and visual identity. Their work includes freelance projects for small businesses.
Methodology & Data Source
Statewide salary figures on this page are 2026 projections based on the Bureau of Labor Statistics Occupational Employment and Wage Statistics (OEWS) survey, May 2026 release. A 3.36% compound annual growth rate (CAGR), derived from 6-year national BLS wage trends, was applied to each metro area's reported salary to estimate current 2026 graphic designer compensation across Washington. State averages are employment-weighted across 50 metro areas — larger metro areas with more graphic designerscontribute proportionally more to the average, producing figures that better reflect typical compensation. Individual pay varies by city, employer, certifications, and experience.
Data Sources & Methodology
Source: BLS, OEWS, 7-year dataset (–). Per-city data from annual BLS metropolitan area surveys.
2026 figures are projected from 2025 BLS data using a compound annual growth rate (CAGR) of 3.36%, derived from historical BLS wage trends for graphic designers (SOC 27-1024).
Compiled and verified by Jordan Lee, MFA, a licensed graphic designer with 10+ years of clinical experience. · View source data at BLS.gov